Statement 750-1000 woorden
about design principles in your assignment, using the following input:
- datavisualisation and storytelling
- transparancy / 'data as beatiful evidence'
- open data / participating interfaces
- use of methaphors
min. 3 sources/references
VOOR VOLGENDE WEEK DO 24 SEPT
-find 3 definitions of datavisualisation
source MLA
- read, summarize and publish on your blog
Edward Tufte, Corrupt Techniques in Evidence Presentations
http://www.edwardtufte.com/bboard/q-and-a-fetch-msg?msg_id=0001et
- select 3 datavisualisations
analysis: how are Tuftes principles used?
- publish the results on your blog
3 definities
- Datavisualisatie, ook wel kennisvisualisatie of wetenschappelijke visualisatie genoemd, is het vakgebied, dat zich bezighoudt met het visueel weergeven van gegevens.
“Datavisualisatie” Wikipedia: The Free Encyclopedia. Wikimedia Foundation, Inc., 19-06-2015. Web. 23-09-2015. https://nl.wikipedia.org/wiki/Datavisualisatie
- Data visualization is the presentation of data in a pictorial or graphical format.
“Data Visualization. What it is and why it is important” Web. 23-09-2015. http://www.sas.com/en_us/insights/big-data/data-visualization.html
- "It feels like we are all suffering from information overload. And the good news is there might be a solution to that and that is using our eyes more. Visualising information so you can see the patterns and connections that matter. And designing that information so it makes more sense, or tells a story, or allows us to focus only on the informations that is important."
- David McCandless in a TedTalk https://www.youtube.com/watch?v=5Zg-C8AAIGg

Chris Jordan
Running the Numbers: An American Self-Portrait
(2006 - Current)
Plastic Bags, 2007 60x72"
Depicts 60,000 plastic bags, the number used in the US every five seconds.
http://www.chrisjordan.com/gallery/rtn/#plastic-bags
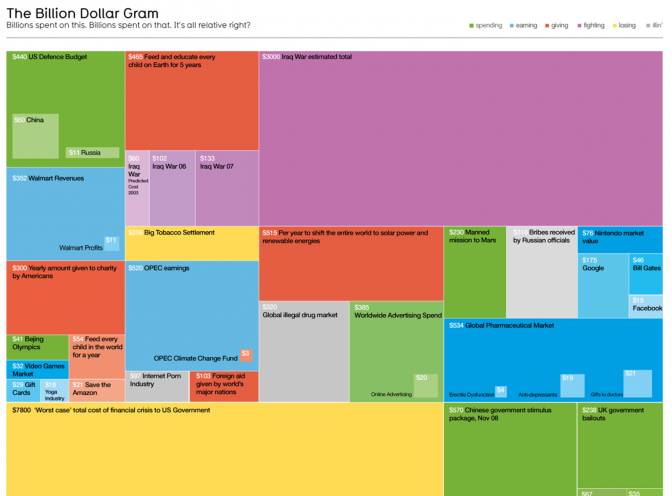
http://www.davidmccandless.com/design_work/#billion-dollar-o-gram-2013-interactive
David McCandless - Billion Dollar O Gram
John Snow - Cholera uitbraak in kaart 1854 London
http://www.thenextview.nl/blog/inzicht-met-datavisualisatie
Tufte's Rules
1. Show your Data
2. Use Graphics
3. Avoid Chartjunk
4. Utilize Data-ink
5. Use Labels
6. Utilize Micro/Macro
7. Seperate Layers
8. Use Multiples
9. Utilize Color
10. Understand Narative
http://www.sealthreinhold.com/school/tuftes-rules/rule_one.php
Tufte's Rules
1. Show your Data
3. Avoid Chartjunk
5. Use Labels
8. Use Multiples
2. Use Graphics (niet gedaan)
4. Utilize Data-ink (nvt)
6. Utilize Micro/Macro (nvt)
7. Seperate Layers (nvt)
9. Utilize Color (niet gedaan)
10. Understand Narative (nvt)
Tufte's Rules
1. Show your Data (niet gedaan)
2. Use Graphics (foto)
3. Avoid Chartjunk (nvt)
4. Utilize Data-ink (nvt)
5. Use Labels (nvt)
6. Utilize Micro/Macro
7. Seperate Layers (nvt)
8. Use Multiples (nvt)
9. Utilize Color (nvt)
10. Understand Narative (nvt)
http://www.sealthreinhold.com/school/tuftes-rules/rule_one.php
Tufte's Rules
1. Show your Data (niet gedaan)
2. Use Graphics
3. Avoid Chartjunk
4. Utilize Data-ink
5. Use Labels (niet gedaan)
6. Utilize Micro/Macro
7. Seperate Layers (niet gedaan)
8. Use Multiples (nvt)
9. Utilize Color (nvt)
10. Understand Narative (nvt)
http://www.sealthreinhold.com/school/tuftes-rules/rule_one.php